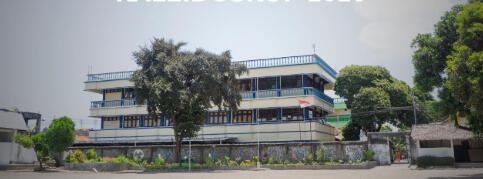
Fauzan Ghazi


Data Analyst
Excel | SQL | Tableau

Data analyst with skills in Excel, SQL, and Tableau, providing data-driven insights and visualization for effective decision making and business growth.


Portfolios & Certifications

Choose skill portfolios by clicking button below.S.T.A.R Method was used for each portfolio.


Reach out to me!

Certifications


Google Data Analytics Certificate

Coursera

The Complete SQL Bootcamp 2022

Udemy

Intermediate SQL Queries

DataCamp

Tableau Desktop

Maven Analytics


Tableau
Market Research

Market research using Google Trends, Excel and Tableau to analyze language popularity in Malaysia (2022)

Tableau
Sales Report

This report presents the sales data for Maven Supplies for the 2017-2018 presentation at the annual report meeting.

Tableau
Massachusetts Education Overview

The data visualization analyzed the impacts of class size, economic disadvantages, and gender on academic performance and graduation rates in Massachusetts schools.


SQL
Data Analysis

Use SQL for data manipulation, data wrangling and analysis to evaluate rental performance for a DVD centre.

SQL
Database Administration

Use MySQL to create and optimize databases using MySQL Workbench for various clients to improve their business operations.


EXCEL
Marketing Analysis

A DoorDash marketing campaign analysis using MS Excel aims to evaluate the efficacy of DoorDash’s marketing efforts.

Excel
Marketing Analysis


Tools: Microsoft ExcelSituation: I was asked to conduct a marketing campaign analysis for DoorDash.Task: Evaluate the effectiveness of DoorDash's marketing efforts and identify areas for improvement.Action: I imported 2,000 rows of data into Excel and analyzed the campaign's target audience, branding, promotion channels, and results in terms of increased sales, customer engagement, and brand awareness.Result: I discovered that 67% of the campaign spend could be explained by income levels, and the company experienced mostly constant growth throughout the year, with the highest in January and the lowest in November. This information will be useful in making future marketing decisions and expanding the business.For detailed workflow, click here

Disclaimer: Part of a guided project from the Data Analytics Accelerator by Avery Smith

Tableau
Market Research


Tools: Excel & TableauSituation: I am a Mandarin language teacher with a passion for opening a language center for Malaysians.Task: Determine the top 5 languages searched on Google by Malaysians in 2022 and consider opening language centers in different states based on this research.Action: I conducted a market research using Google Trend data analysis to determine the popularity of different languages among Malaysians.Result: The Mandarin language was the most searched language in Malaysia, while Arabic was not as popular. Based on this research, I plan to open a Mandarin language center in Malaysia and potentially consider other locations based on language popularity.For detailed workflow, click here

This Tableau dashboard can be accessed interactively here

Tableau
Sales Report


Tools: TableauSituation: Maven Supplies needed an executive-level business intelligence (BI) solution to track key performance indicators (KPIs) and analyze data from various sources.Task: I'm designing and building a BI dashboard.Action: I connected and transformed raw data from Excel files and designed interactive reports and dashboards to complete the task.Result: I created an executive KPI dashboard containing dynamic filtering options, high-level trending metrics, sales and goal performance, geospatial distribution, and trending month over month.For detailed workflow, click here

This Tableau dashboard can be accessed interactively hereDisclaimer: Part of a guided project from the Intro to Tableau Desktop by Maven Analytics

Tableau
Massachusetts Education Overview


Tools: TableauSituation: Massachusetts schools are analyzing academic performance and graduation rates.Task: Understand the impacts of class size, economic disadvantages, and gender on these outcomes.Action: Created a data visualization to illustrate the relationships between these factors and academic performance and graduation rates in Massachusetts schools.Result: The data visualization showed that class size had little impact on graduation rates, but economic disadvantage, gender, and being a "high needs" learner did. 75% of students are attending college after high school, with the remaining students enrolled in community college or other programs or having dropped out. More data is needed to understand post-high school choices.

This Tableau dashboard can be accessed interactively hereDisclaimer: Part of a guided project from the Data Analytics Accelerator by Avery Smith

SQL
Data Analysis


Tools: SQLSituation: I was asked to conduct an analysis of DVD rental data for a company.Task: Use SQL to analyze the data and identify trends and patterns in DVD rentals.Action: I used SQL to query the database and extract relevant data, including information on customer demographics, rental history, and popular movies. I then used this data to create various reports and charts to visualize the trends and patterns in DVD rentals.Result: Through the analysis, we were able to identify the most popular movies and genres, as well as customer preferences based on demographics such as age and gender. In 2018, we saw a trend of increased rentals of action and adventure movies, particularly among male customers in the 25-34 age range. This information will be useful in informing the company's future marketing and inventory management decisions.For detailed workflow and SQL code, click here

Disclaimer: Part of a guided project from the MySQL Data Analysis by Maven Analytics

SQL
Data Administration


Tools: DBeaver & MySQLSituation: I have just been hired by a small database consulting shop where I will be working on projects for various clients to help them get their databases built and optimized for their businesses.Task: As a consulting team member, I am asked to perform database services for various clients. These tasks will include working with existing databases and tables to make small improvements, as well as setting up databases for clients from the ground up.Action: To complete these tasks, I will use MySQL Workbench to create databases and tables for my client's businesses. I will use my knowledge of database best practices to implement and optimize database design principles. Additionally, I will update records, create indexes, triggers, and stored procedures, and manage users and permissions as needed.Result: By completing these tasks, I will be able to help my clients' businesses run smoothly and efficiently by optimizing their databases. This will enable them to access and process data quickly and accurately, which will ultimately help them grow and succeed.For detailed workflow and SQL code, click here

Disclaimer: Part of a guided project from the MySQL Database Administration by Maven Analytics